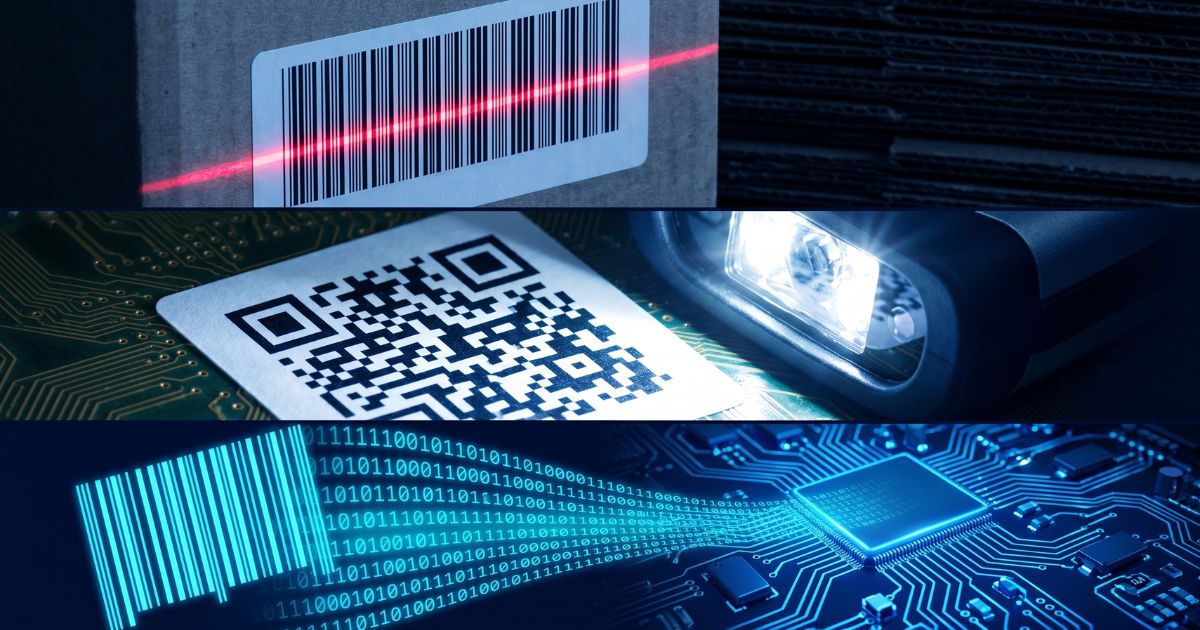
How Barcode Scanning Works: From Light Source to Data Output
From Scan to System: What Actually Happens in Milliseconds
Press the trigger on a barcode scanner, and the result appears on your screen in under 100 milliseconds. That speed makes the underlying process easy to take for granted — but understanding what happens inside those milliseconds has direct practical implications for anyone selecting, deploying, or troubleshooting scanning hardware.
A barcode scanner is not simply a camera that reads printed patterns. It is a purpose-built signal processing system: one that converts physical light into a structured data stream your inventory, POS, or warehouse management software can act on. The pipeline involves six distinct stages, each with its own engineering trade-offs that influence real-world scanner performance.
Step 1–2: Illumination and Reflection — The Signal Starts Here
Every scan begins with light. The scanner projects a light source onto the barcode surface, and the barcode responds — not with information exactly, but with a contrast pattern that encodes it.
Illumination — three dominant technologies:
- Laser scanners emit a coherent, monochromatic beam typically swept across the barcode by an oscillating mirror. The single-line sweep is fast and precise for 1D barcodes but cannot natively read 2D symbols.
- LED/linear imagers illuminate the entire barcode area with a broad light source and capture the full image in a single exposure. No moving parts, lower power draw, and capable of reading 2D codes including QR and Data Matrix.
- Area imagers (2D imagers) use a two-dimensional sensor array — functionally similar to a camera — that captures the full barcode field in one frame. This enables omnidirectional reading and handles damaged, tilted, or screen-displayed codes.
Reflection — the physics of contrast:
The barcode's information is encoded in the width and spacing of its bars and spaces. Dark bars absorb the projected light; white spaces reflect it back toward the scanner's sensor. The resulting pattern of high and low reflectance values — captured in sequence across the barcode width — is the raw signal the scanner works with. Without sufficient contrast between bars and spaces, the sensor cannot distinguish signal from noise. This is why label quality, print density, surface reflectance, and ambient lighting conditions all affect scan reliability.
Step 3–4: Detection and Analog-to-Digital Conversion
The reflected light pattern reaches the scanner's photodetector — either a single photodiode (in laser scanners) or a CCD/CMOS image sensor array (in imagers). The sensor converts incoming light intensity into a proportional electrical current: bright areas produce higher current, dark areas produce lower current.
This electrical output is analog — a continuous waveform whose amplitude varies with the pattern of light and dark across the barcode. Before any meaningful processing can occur, this signal must be digitized.
Analog-to-digital conversion (ADC) samples the electrical signal at high frequency and assigns binary values: regions above a threshold become 1 (light/space), regions below become 0 (dark/bar). The resulting binary string is a digital representation of the bar and space pattern — now processable by the scanner's decoder chip.
Sensor quality and ADC precision are major differentiators between entry-level and enterprise-grade scanners. Higher-quality sensors maintain reliable signal extraction from labels that are partially damaged, low-contrast, or printed at non-standard densities.
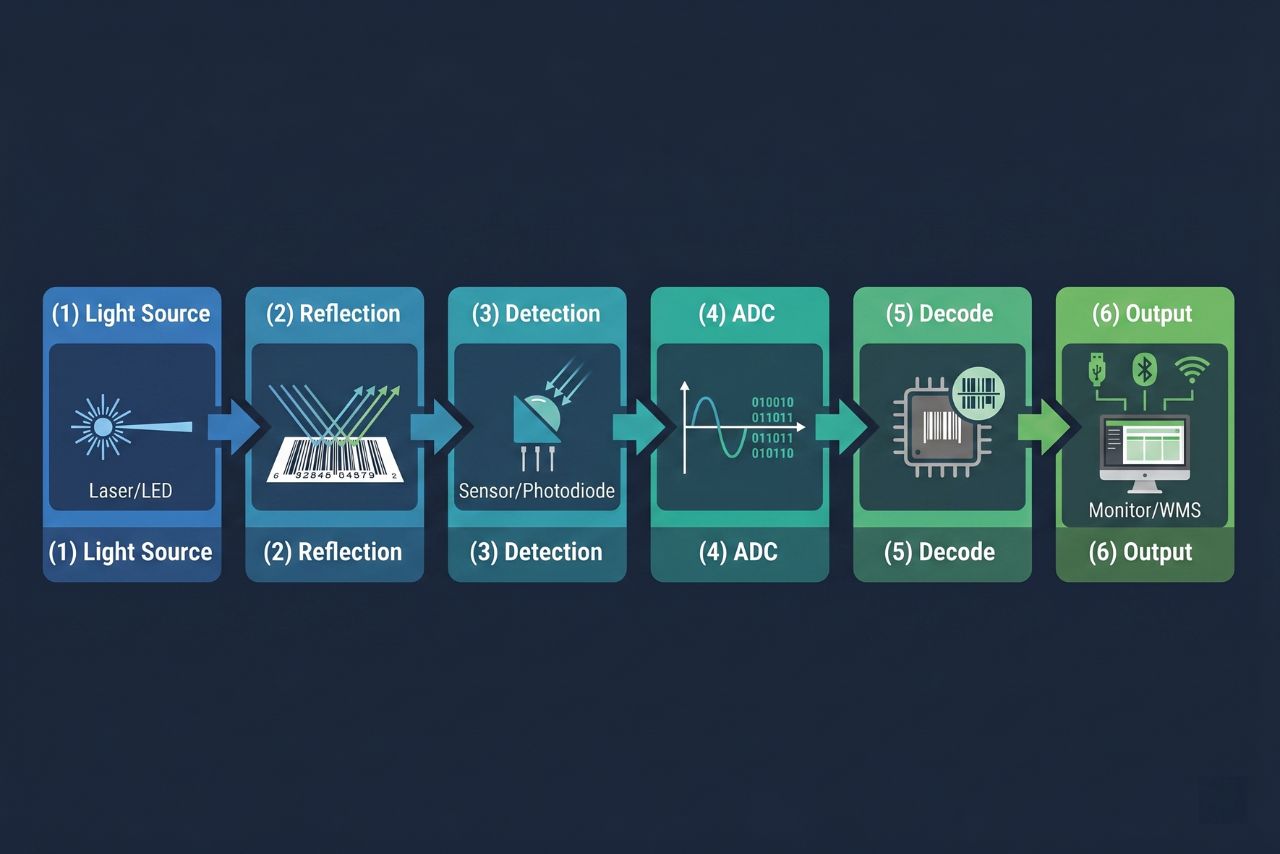
Six-Stage Scanning Pipeline — Summary
| Step | Stage | What happens | Why it matters |
|---|---|---|---|
| 1 | Illumination | Light source emits beam onto barcode surface | Consistent illumination enables reliable reflection contrast |
| 2 | Reflection | Dark bars absorb light; white spaces reflect it back | The contrast ratio between bars and spaces is the raw data signal |
| 3 | Detection | Photodiode or image sensor captures reflected light pattern | Sensor quality determines read rate on damaged or low-contrast labels |
| 4 | Analog-to-Digital Conversion | Varying light intensities converted to electrical signals, then binary | Converts physical pattern into machine-processable data |
| 5 | Decoding | Processor applies symbology rules (UPC, Code 128, QR, etc.) to binary data | Symbology-specific algorithms translate binary into human-readable output |
| 6 | Data Output | Decoded data transmitted via USB, Bluetooth, Wi-Fi, or serial interface to host system | Interface choice determines real-time vs. batch data flow |
Step 5: Decoding — Where Symbology Rules Apply
Decoding is where raw binary data becomes meaningful information. The scanner's onboard processor receives the binary string from the ADC stage and applies the mathematical rules of the specific barcode symbology it has identified.
Different symbologies encode data differently. UPC-A, the standard retail barcode, encodes 12 numeric digits using a specific bar-width encoding scheme. Code 128 supports the full ASCII character set with variable-length encoding. QR codes use a 2D matrix structure with built-in error correction. Data Matrix, PDF417, and Aztec each follow distinct encoding grammars.
The decode engine must first identify which symbology is present — often by reading guard patterns or finder patterns at the barcode's edge — then apply the corresponding ruleset to extract the payload. Modern industrial scanners carry decoders capable of recognizing dozens of symbologies simultaneously, switching between them automatically based on what the sensor data suggests.
Decode speed and first-read rate (the percentage of scan attempts that succeed on the first try) are direct products of decoder quality. In high-throughput environments — automated conveyor lines, high-density warehouse picking — a decoder that achieves 99%+ first-read rates at high scan speeds is not a premium feature: it is an operational requirement.
Step 6: Data Output — Getting Scan Data to Your System
Once decoded, the alphanumeric payload must reach the host system. The output interface is the final stage of the pipeline — and the one most visible to IT and operations teams during deployment.
Common output interfaces:
- USB (HID keyboard emulation): The scanner presents itself as a keyboard; decoded data is inserted directly into the active input field. No driver installation required. Simple, universal, and appropriate for point-of-sale and fixed workstation environments.
- USB (virtual COM / CDC): Data is transmitted via a serial-emulation protocol, giving the host application direct programmatic access to the scan stream — more flexible for custom integrations.
- RS-232 serial: Legacy interface still found in industrial fixed-mount and kiosk deployments. Supports bidirectional communication for scanner configuration and acknowledgment signaling.
- Bluetooth (SPP / HID): Wireless output to a paired host device. Suitable for mobile POS, tablet-based inventory, and applications requiring cable-free mobility within a limited radius.
- Wi-Fi (802.11): The scanner connects directly to the network and transmits data to the WMS or ERP in real time. Required for large-footprint operations where Bluetooth range is insufficient and continuous data synchronization is a system requirement.
The output interface determines data latency. USB HID and serial connections are effectively instantaneous. Bluetooth introduces milliseconds of transmission delay — negligible for most applications. Wi-Fi performance depends on network infrastructure quality and congestion, though modern enterprise Wi-Fi 6 deployments support scanner-density requirements at very low latency.
Why This Pipeline Matters for Scanner Selection
Most scanner procurement conversations start with form factor and price. Understanding the scanning pipeline shifts that conversation toward the variables that actually determine whether a device will perform reliably in your specific environment.
Light source choice determines which barcode types you can read and how well the scanner handles distance, motion, and ambient light interference.
Sensor and ADC quality determine read reliability on degraded labels — a variable that grows more significant in high-velocity operations where poor first-read rates multiply into measurable throughput losses.
Decode engine capability determines which symbologies are supported and how the scanner performs at the edge: on damaged barcodes, at long range, or in motion.
Output interface determines how scan data flows into your system — and whether that flow meets your real-time data requirements.
Each stage of the pipeline presents trade-offs. A laser scanner is fast and cost-effective for 1D retail environments; an area imager is necessary for 2D codes or omnidirectional fixed-mount applications. A scanner with USB HID output is plug-and-play for a POS terminal; one with Wi-Fi output is required for a real-time warehouse management system.
If you are evaluating which scanner technology fits your operation, the Buyer's Guide section of this blog covers selection criteria by environment, use case, and form factor — a logical next step once the technical foundations are clear.